


The Anatomy of Market Exhaustion
Bitcoin is currently exhibiting several key indicators of market capitulation. Recent data shows that eight out of twelve specialized metrics have entered their extreme zones—a phenomenon that has historically preceded major market shifts. These signals track various dimensions of market stress, including price drawdowns from recent peaks, the economic health of network miners, and the volume of investors currently holding positions at a loss.
When these indicators cluster in extreme ranges, it typically signifies a period of intense selling. However, recent data suggests that while the signals are firing, the market may not have reached its absolute floor just yet.
Historical Returns: A Lesson in Patience
For investors looking for a quick rebound, history offers a sobering perspective. Analyzing past cycles where eight to twelve of these indicators were triggered reveals a specific pattern of recovery:
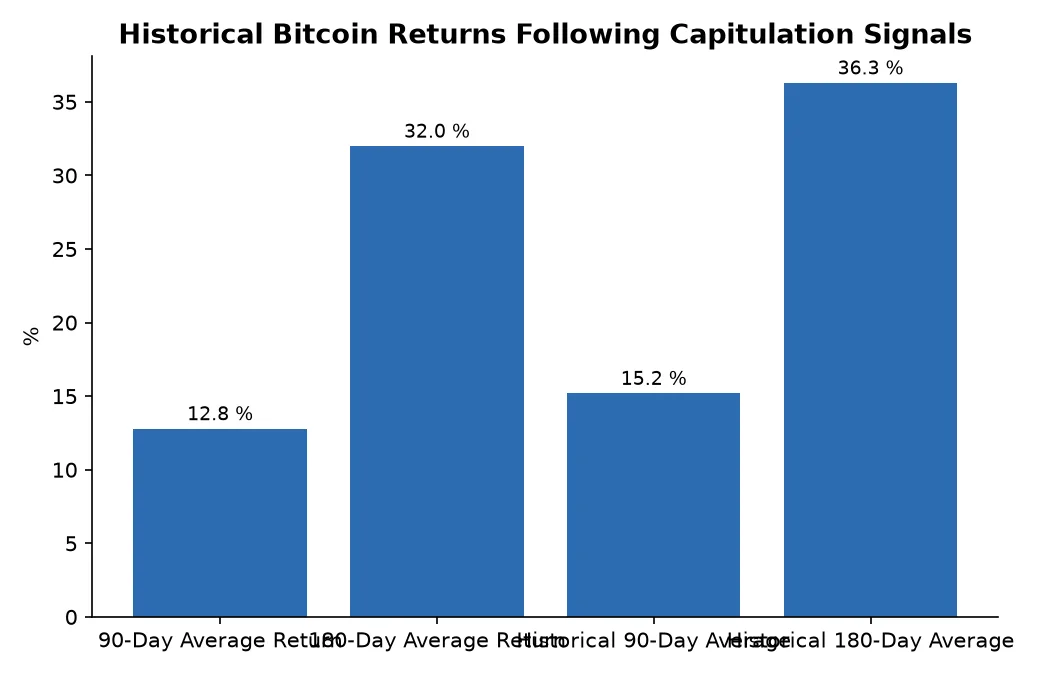
- 90-Day Window: Historically, Bitcoin has returned an average of 12.8% following such signals.
- 180-Day Window: The average return extends to 32% over a six-month period.
Notably, these figures fall slightly below the long-term historical averages for Bitcoin, suggesting that the immediate aftermath of capitulation signals can be volatile and may not offer a significant statistical edge for short-term traders. The most consistent advantages appear to manifest over a one-year investment horizon.
The Impact on Network Miners
The pressure of the current market cycle is most visible within the mining sector. As price volatility settles, the economics of securing the network have tightened significantly. Key shifts include:
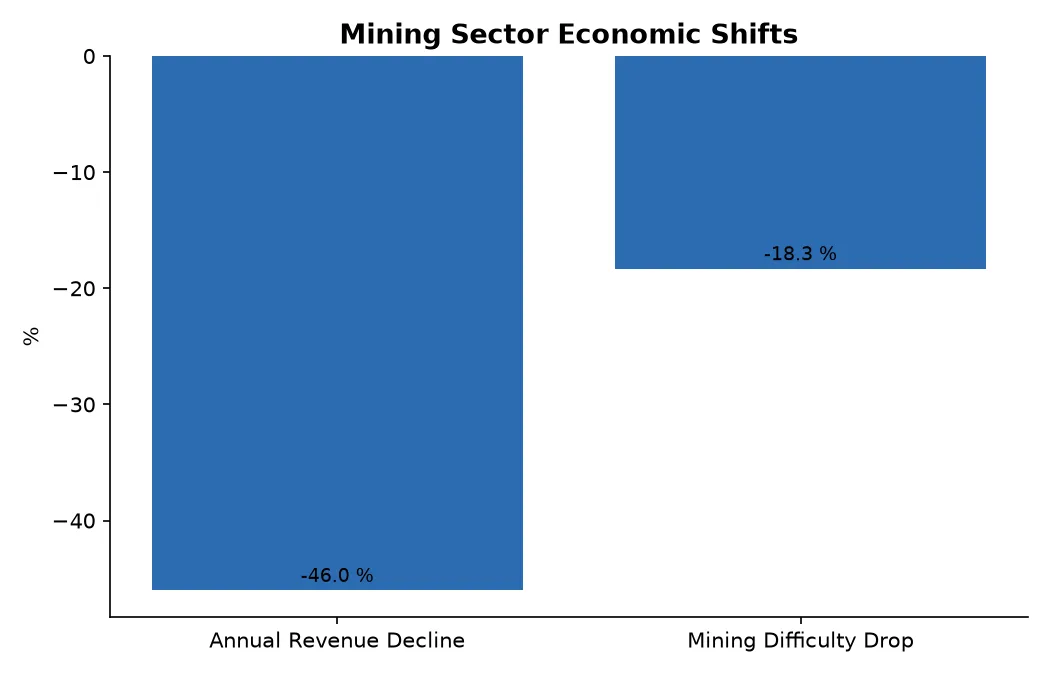
- Revenue Decline: Daily network revenue has dropped by approximately 46% compared to last year.
- Difficulty Adjustment: Mining difficulty has decreased by 18.3% from its recent peak, driven by unprofitable hardware being taken offline.
This reduction in difficulty represents one of the most significant shifts since 2021, as the network adjusts to the changing profitability of its participants.
Institutional Inflows vs. Retail Sentiment
Despite the bearish signals in price and mining revenue, institutional interest remains a powerful counter-force. While the market recently saw significant outflows, there has been a massive reversal in recent weeks. U.S. spot exchange-traded products have seen roughly $663 million in inflows over a recent 30-day period, effectively clawing back much of the capital that exited the market the previous month.
This tug-of-war between retail exhaustion and institutional accumulation defines the current landscape. For those tracking the market cycle, the data suggests that while the ‘bottom’ is a moving target, the structural interest in digital assets remains robust.