


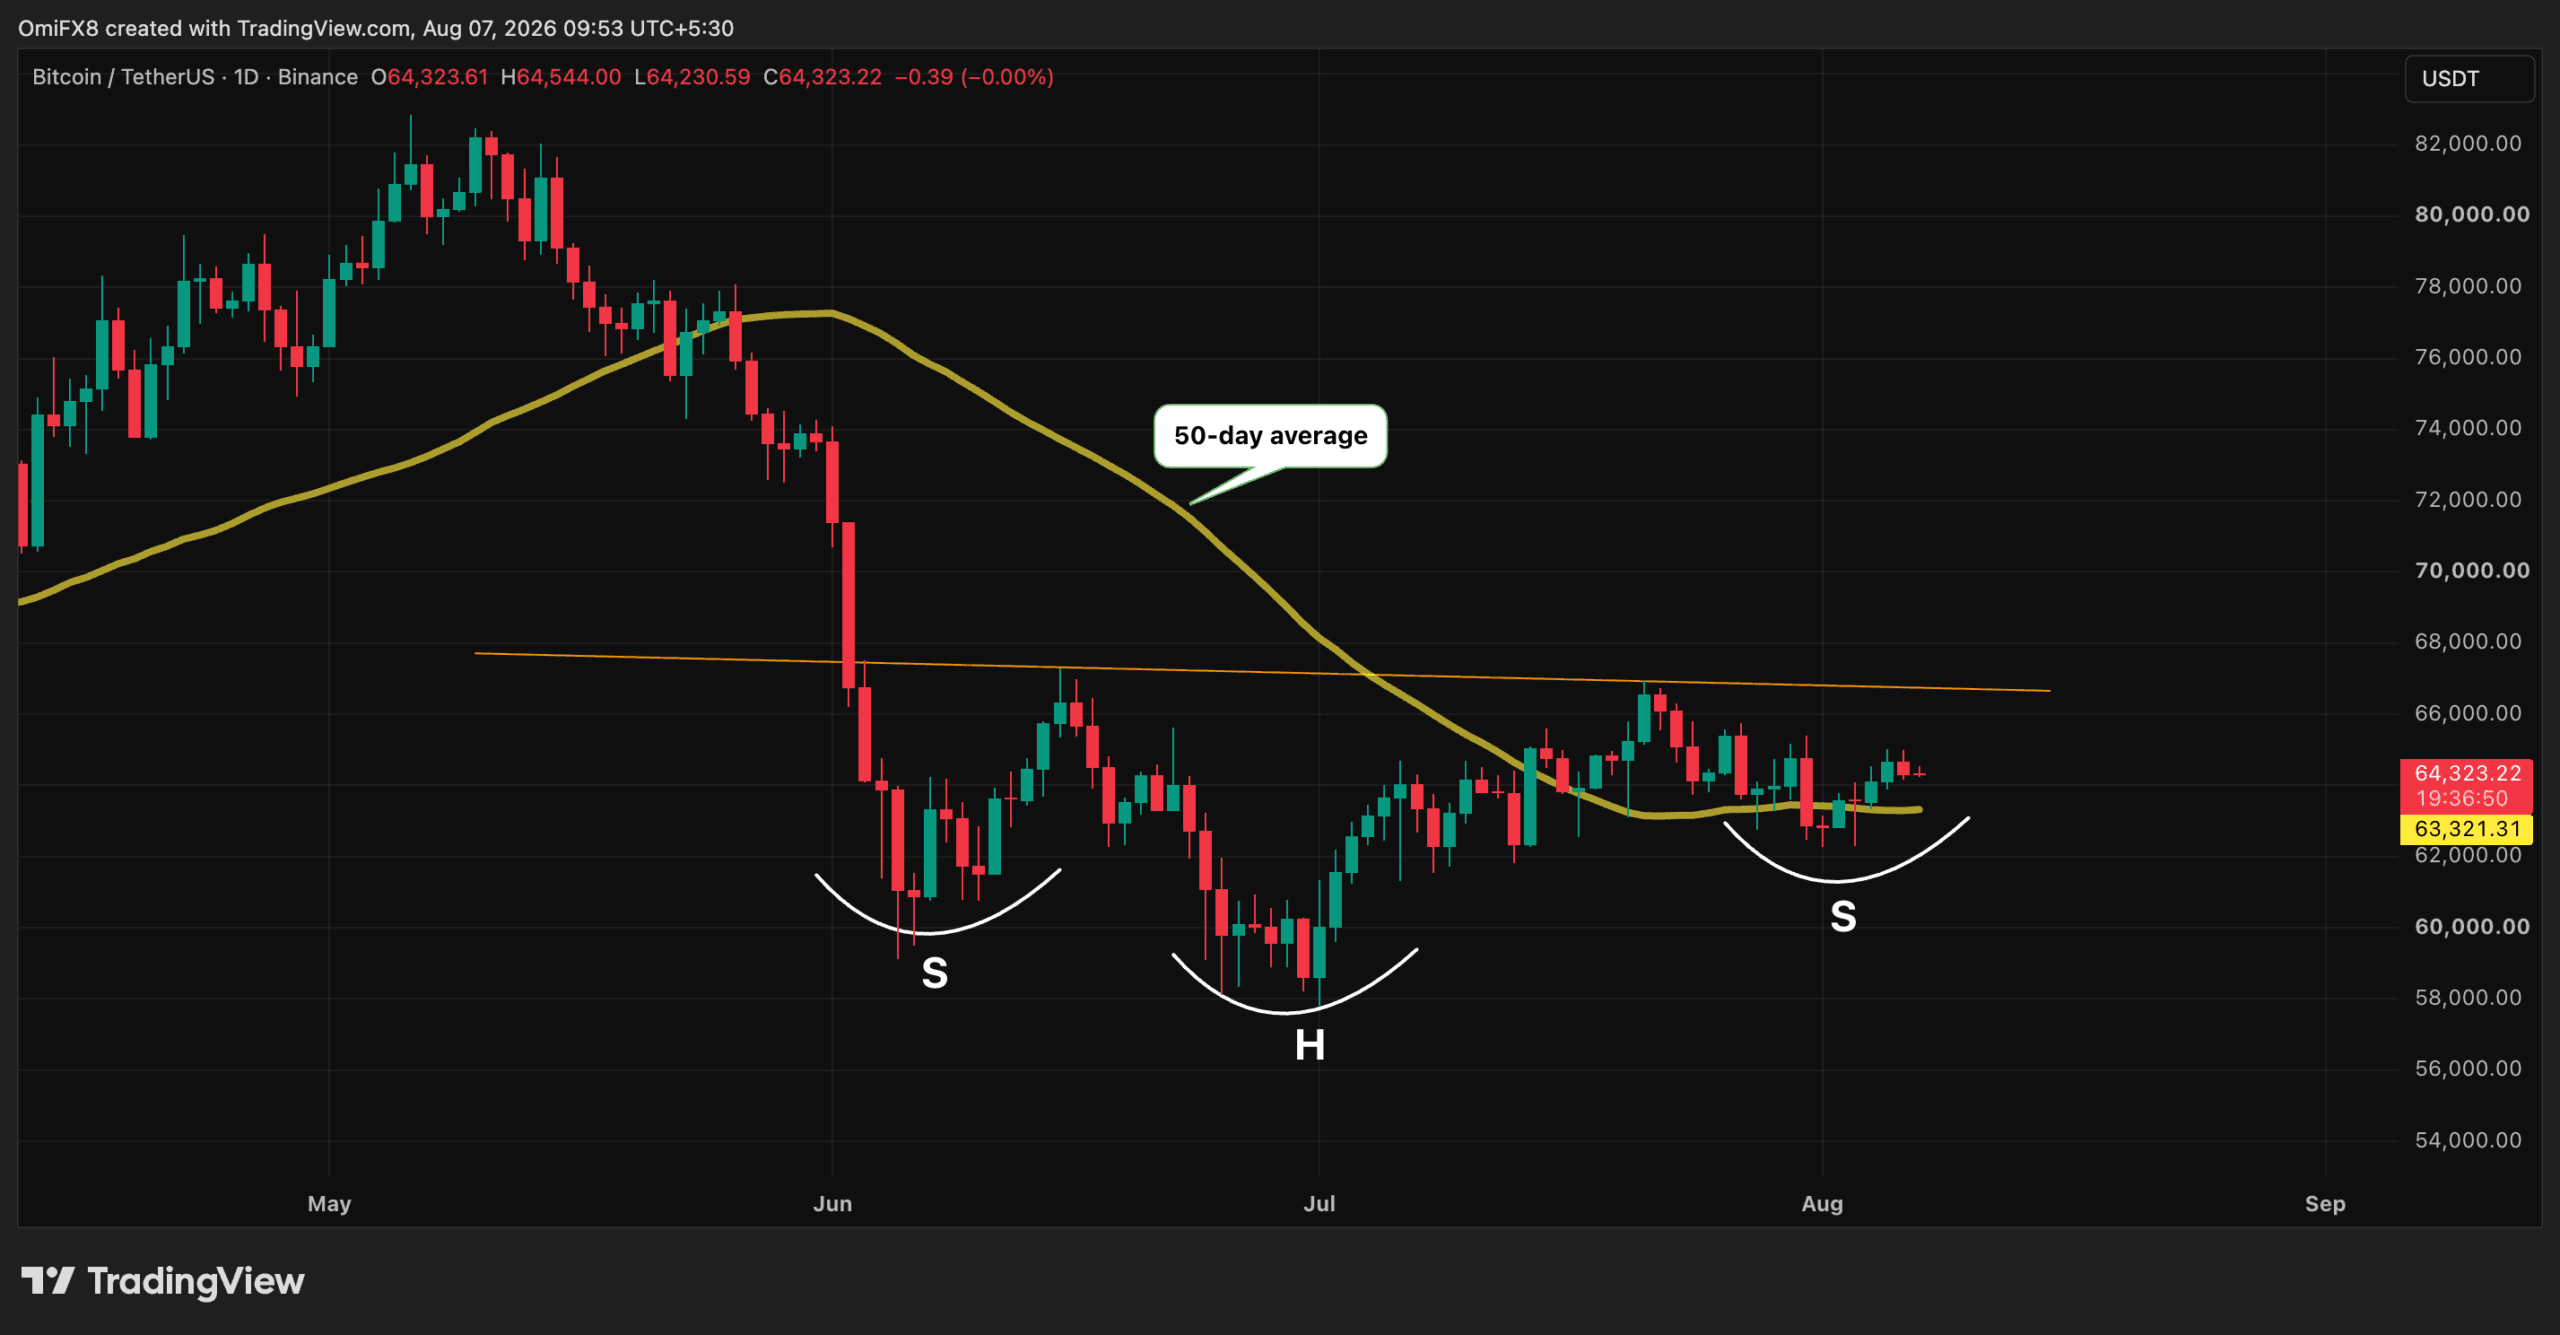
Decoding the Emerging Bitcoin Pattern
In the volatile world of digital assets, technical analysis remains a cornerstone for traders attempting to predict future price movements. Currently, Bitcoin is displaying a specific chart formation that has caught the attention of market observers. This pattern, characterized by specific sequences of higher lows and resistance tests, often precedes significant volatility.
When such patterns emerge, they typically signal a period of consolidation before a major breakout. For Bitcoin, the current structure suggests that the asset is building momentum. If the market can successfully defend key support levels, the momentum could shift from sideways movement to a vertical ascent.
The Path to $76,000
The psychological and technical milestone of $76,000 is more than just a number; it represents a significant resistance zone that has historically challenged bulls. A breakout above this threshold would likely be triggered by a combination of technical strength and broader market sentiment.
Several factors could contribute to this potential rally:
- Volume Confirmation: A successful breakout requires an increase in trading volume to confirm that the upward movement is backed by significant capital inflow.
- Support Level Stability: The ability of Bitcoin to maintain its current floor is crucial. If buyers remain aggressive at lower price points, the upward trajectory becomes much more probable.
- Market Sentiment: Beyond the charts, the general mood of the crypto community and macroeconomic factors play a decisive role in determining whether a pattern completes its cycle.
Risk Management and Market Volatility
While technical patterns provide a roadmap, they are not guarantees of future performance. The cryptocurrency market is notorious for ‘fakeouts’—scenarios where a pattern appears to be forming, only to reverse sharply. Traders should always approach these technical signals with caution and maintain strict risk management protocols.
As Bitcoin approaches these critical levels, the interplay between automated trading algorithms and human sentiment will continue to drive intense volatility. Whether the current pattern leads to a $76,000 breakout or a trend reversal depends on the immediate reaction to upcoming market liquidity shifts.