

What Is the Golden Cross, and Why Does It Matter?
The golden cross is one of the most enduring patterns in technical analysis. It forms when an asset’s 50-day moving average climbs above its 200-day moving average, suggesting that recent price momentum has overtaken the broader trend. While the specific numbers — 50 and 200 days — carry no mathematical magic, they have become industry standards after generations of traders adopted them across stocks, bonds, commodities, and eventually cryptocurrencies.
The catch is that moving averages are inherently reactive. They trail price action rather than anticipate it, which means the golden cross frequently appears after a significant portion of the rally has already unfolded. For bitcoin, this limitation is especially relevant given the asset’s history of sharp, sudden reversals.
A Complicated History: 12 Crosses, Mixed Results
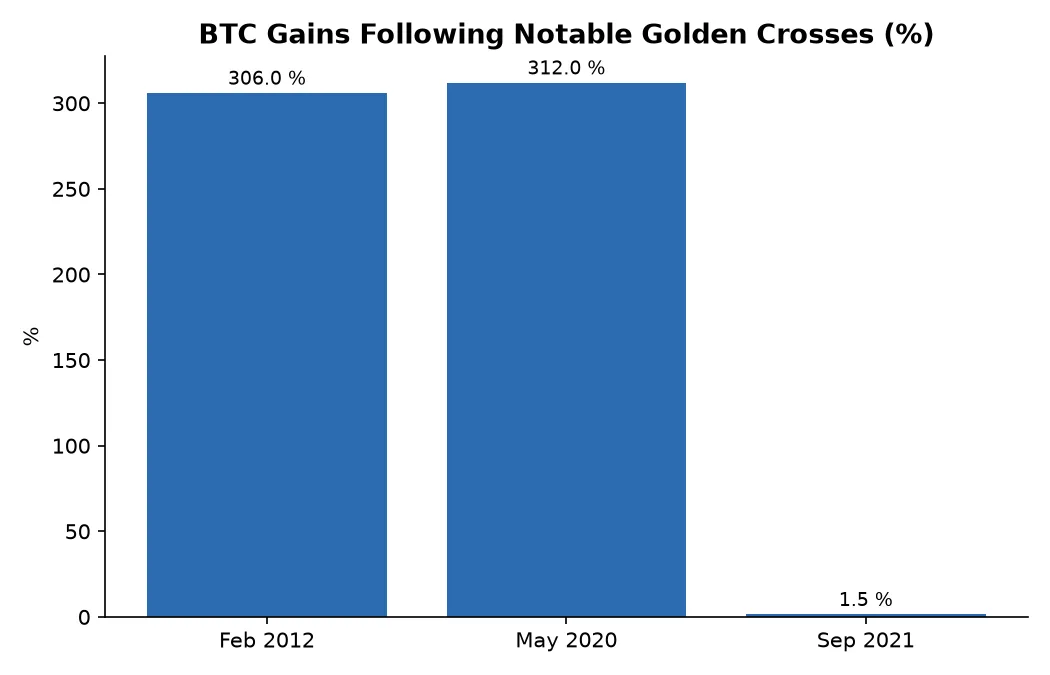
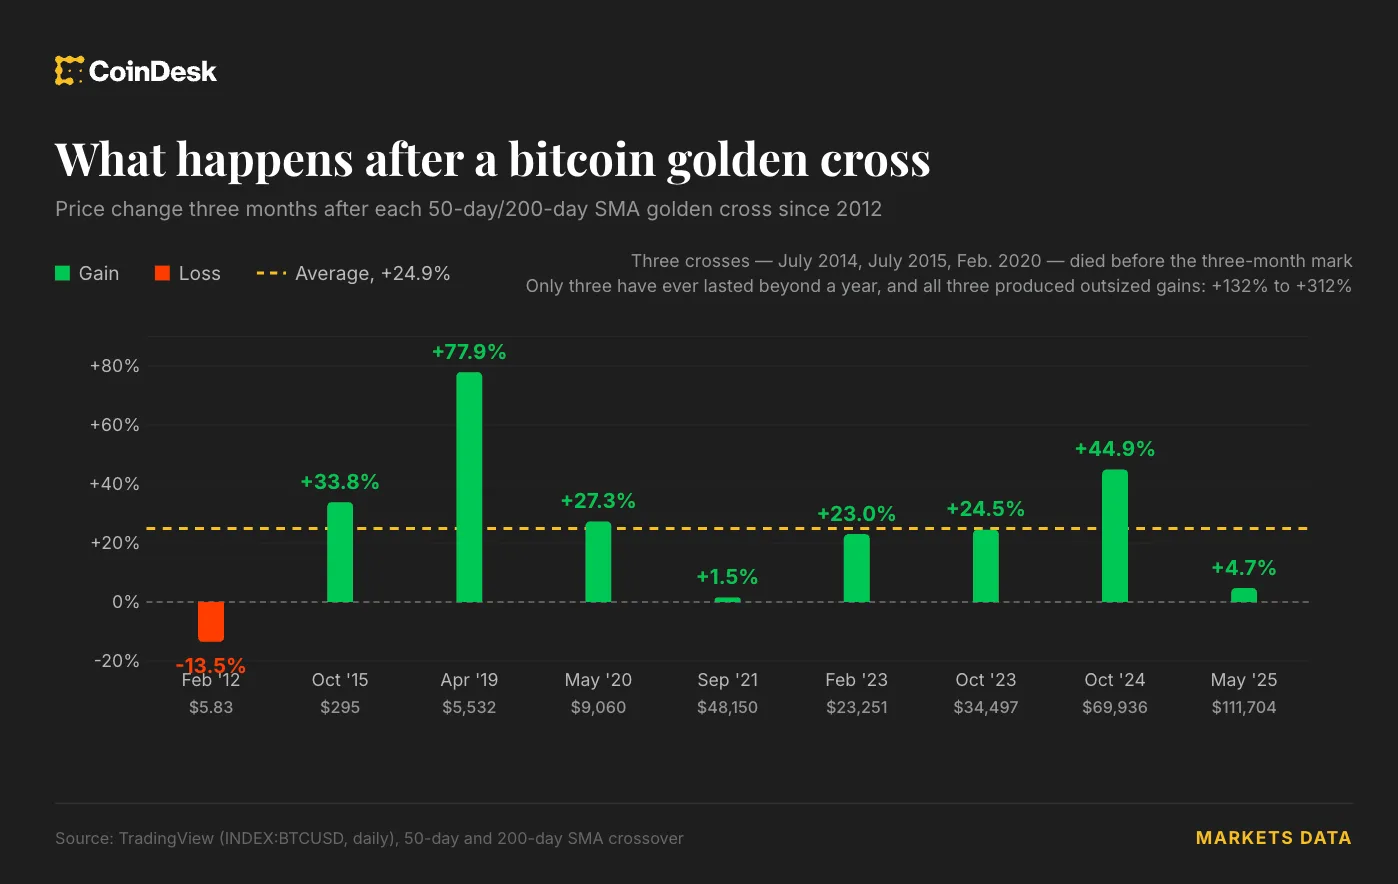
Since 2012, bitcoin has produced the golden cross pattern on 12 separate occasions. The outcomes have been strikingly uneven. Three instances delivered extraordinary, sustained rallies: the February 2012 cross was followed by a 306% gain over the next year; the May 2020 cross produced a 312% advance over the following twelve months, with bitcoin ultimately reaching nearly $64,900; and the October 2015 cross held firm for over two years, carrying the asset to what was then a record high near $19,800.
But several other crosses barely registered before collapsing. Two instances in mid-2014 and mid-2015 were negated by an opposing death cross within just two months — too soon to even measure a three-month return. A September 2021 cross managed only a 1.5% gain before fizzling out a few months later, shortly before bitcoin plunged more than 70% from its peak over the following year.
The Short-Term Record Looks Reasonable
When the data is aggregated, a clearer picture emerges. Across the nine crosses where a three-month return could be measured, the average gain came in at 24.9%. That is a respectable short-term track record. However, reaching the one-year mark intact has been the exception rather than the norm: only three of the twelve crosses survived a full year without being disrupted by a death cross first. Among those three survivors, the average twelve-month gain was 250%.
The takeaway is nuanced. The golden cross has decent predictive power over a three-month horizon, but its reliability drops sharply over longer timeframes. Making it to a one-year milestone has historically been rare.
USDT Dominance: A Complementary Signal
Beyond the moving averages, another market metric is moving in a direction typically associated with rising crypto prices. USDT dominance measures tether’s total circulating value as a share of the entire cryptocurrency market. A declining dominance rate is generally interpreted as a risk-on indicator, suggesting capital is rotating out of the dollar-pegged stablecoin and into higher-risk assets like bitcoin.
It is worth noting that dominance is a ratio, so it can fall simply because risk assets are rallying faster than stablecoin supply expands — even if no one is actively selling USDT. Historically, shifts in this metric have marked major trend changes for bitcoin. For instance, the dominance rate formed its own golden cross in November of last year and then surged as bitcoin began declining.
That ratio is now approaching a death cross of its own, with its 50-day average set to fall below the 200-day average. A sustained drop in USDT dominance would suggest that a smaller share of the crypto market’s total value is parked in stablecoins — a configuration that has historically preceded bullish phases.
What to Watch Going Forward
Whether the upcoming golden cross will hold remains uncertain. Bitcoin’s own history with this signal is a story of impressive gains interspersed with abrupt failures. The simultaneous movement in USDT dominance adds an intriguing layer, but it is not a guarantee. For now, both metrics are pointing in a direction that has historically been associated with upward momentum — but the burden of proof, as always, lies in whether the pattern can survive long enough to matter.