

The Return of the ‘Bart Simpson’ Pattern
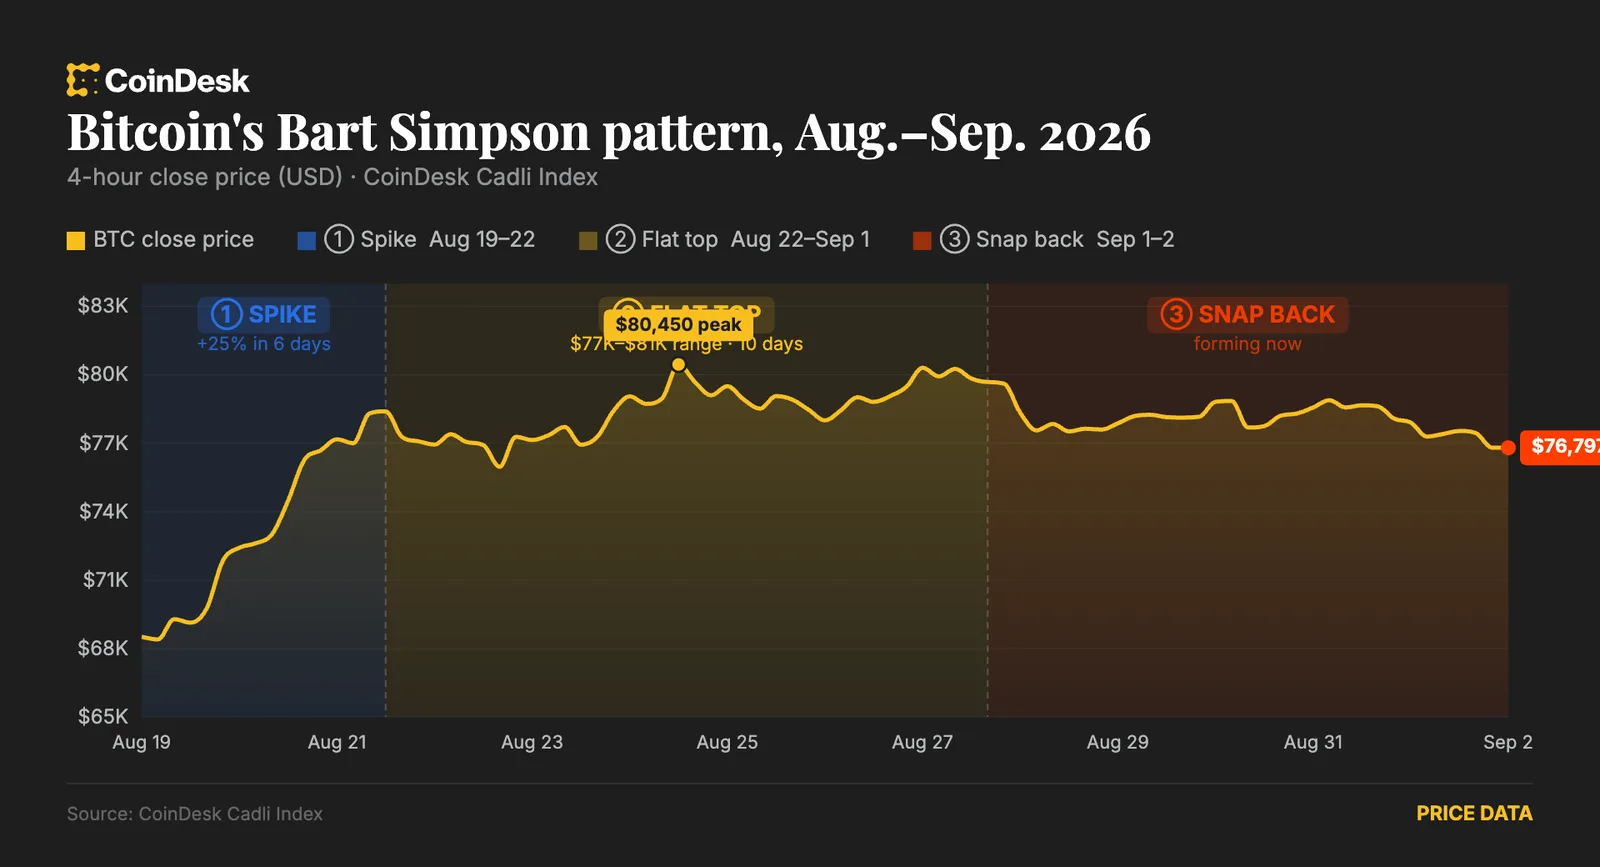
After a period of intense market activity, the digital asset landscape is showing signs of fatigue. Traders are increasingly concerned about a specific technical phenomenon: the emergence of the ‘Bart Simpson’ pattern. In technical analysis, this pattern is characterized by a sharp vertical move, followed by a period of sideways consolidation, and finally, a steep decline.
This sequence often mimics the silhouette of the famous animated character, and for investors, it serves as a warning sign. When this pattern completes, it typically suggests that the previous upward momentum has been exhausted, leaving the market vulnerable to a significant sell-off.
Impact on Bitcoin and XRP
The current market correction is being felt most acutely by market leaders. Bitcoin, the primary bellwether for the entire crypto ecosystem, has seen its recent gains eroded as buyers step back. This cooling period is essential for long-term stability, but in the short term, it creates uncertainty for retail and institutional investors alike.
XRP is also facing notable headwinds. Despite various fundamental drivers, the technical structure of XRP has mirrored the broader market’s struggle to maintain higher price levels. The simultaneous pullback in both Bitcoin and XRP suggests a macro-level shift in sentiment rather than an isolated event affecting a single asset.
What Should Investors Watch For?
As the market navigates this volatility, several key factors will determine if this is a healthy correction or the start of a deeper bear trend:
- Volume Confirmation: A breakdown in price accompanied by high selling volume would validate the bearish pattern.
- Support Levels: Investors are looking at historical price floors to see if buyers step in to defend key zones.
- Market Sentiment: The transition from extreme greed to fear often precedes the completion of such technical patterns.
While technical patterns are not infallible, they provide a framework for understanding market psychology. For those navigating the current volatility, patience and risk management remain the most critical tools in a shifting landscape.