


The Reverse Magic of Compounding
Investors are often taught the power of compounding returns—where dividends are reinvested to buy more shares, which in turn generate more dividends. However, there is a mirror image to this process: the compounding of costs. Every dollar paid in fees is not just a loss of immediate cash, but a loss of all the future growth that money would have generated if it had remained invested.
Over several decades, even a fraction of a percentage point in fees can create a staggering gap in final portfolio value. This makes the expense ratio—the annual fee charged by an ETF as a percentage of its assets—one of the most critical metrics for any serious investor to monitor.
Decoding the Expense Ratio
Unlike a brokerage commission, you won’t receive a monthly bill for ETF fees. Instead, these costs are deducted daily from the fund’s Net Asset Value (NAV). Because the process happens behind the scenes, it is easy to overlook. To calculate the actual cost, simply multiply your investment amount by the expense ratio. For instance, a 0.10% fee on a $10,000 investment equals $10 per year.
These fees typically cover several operational needs, including:
- Management Fees: Compensation for the team operating the portfolio.
- Operational Costs: Legal services, accounting, and custody of assets.
- Licensing: Payments to the providers of the indices the ETF tracks.
In some cases, « fund-of-funds » structures may introduce additional layers of fees from the underlying assets, increasing the total cost to the shareholder.
Active vs. Passive: The Cost Divide
Generally, passive index ETFs are significantly cheaper than actively managed ones. A passive fund simply mirrors a benchmark, requiring less human intervention. In contrast, active funds employ analysts and managers to pick specific securities, a process that commands higher fees.
Complexity also drives costs. While a broad market index fund might cost only a few basis points, specialized ETFs focusing on narrow sectors or utilizing complex derivatives (like leverage or short-selling) often see expense ratios exceeding 0.75%.
The Real-World Cost of a Few Basis Points
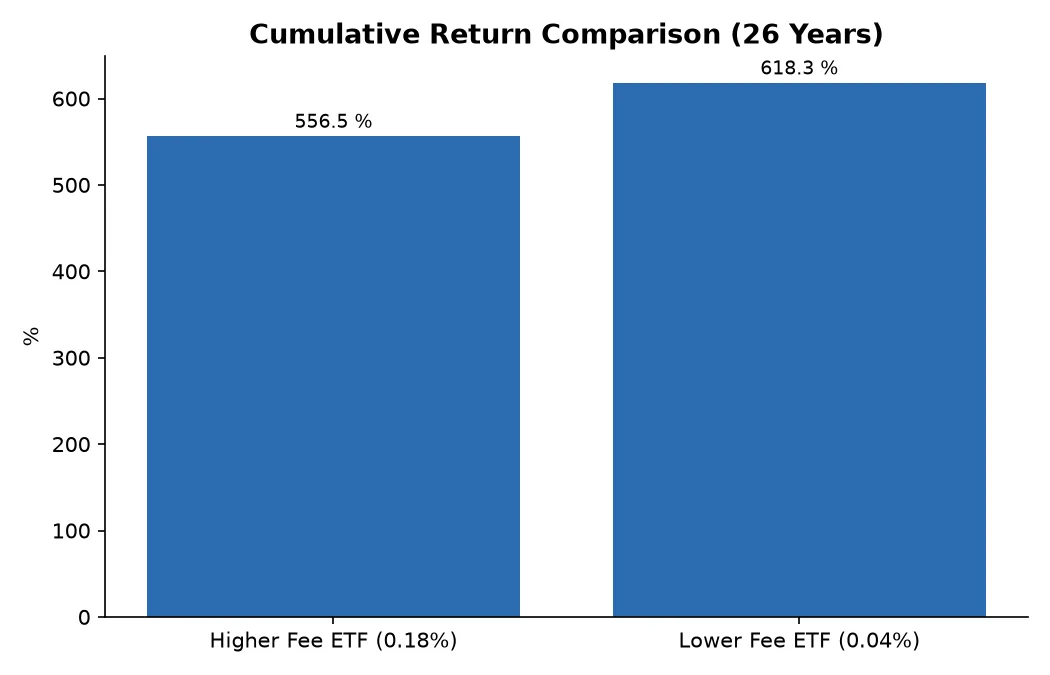
To illustrate the impact, consider two ETFs tracking the same value index. If one charges 0.18% and another charges 0.04%, the difference seems negligible in a single year. However, over a 26-year horizon, this gap can be transformative. Data shows that an initial $10,000 investment in the lower-cost option could outperform the more expensive alternative by over $6,000, simply due to the lower drag of fees.
Finding Ultra-Low-Cost Options
Competition among asset managers has led to a « race to the bottom, » resulting in the emergence of zero-fee ETFs. Some providers achieve this by using less expensive indices or generating revenue through securities lending—loaning stocks to other market participants in exchange for fees.
Across different asset classes, low-cost entries now exist for almost every strategy:
- Equities: Zero-fee options now provide diversified exposure to large-cap U.S. stocks.
- Fixed Income: Some core bond ETFs have eliminated management fees entirely.
- Commodities: Physical gold ETFs can now be found with expense ratios as low as 0.09%.
- Digital Assets: Spot Bitcoin ETFs have seen rapid fee compression, with some charging as little as 0.14%.
By using online screeners to compare similar funds, investors can eliminate unnecessary costs and keep a larger share of their market returns.