

The Intersection of Corporate Strategy and Technical Indicators
In the evolving landscape of digital asset markets, the actions of major corporate players often serve as a barometer for institutional sentiment. One of the most prominent examples is the aggressive Bitcoin accumulation strategy employed by major tech-focused firms. This approach has moved beyond simple speculation, becoming a core component of corporate treasury management.
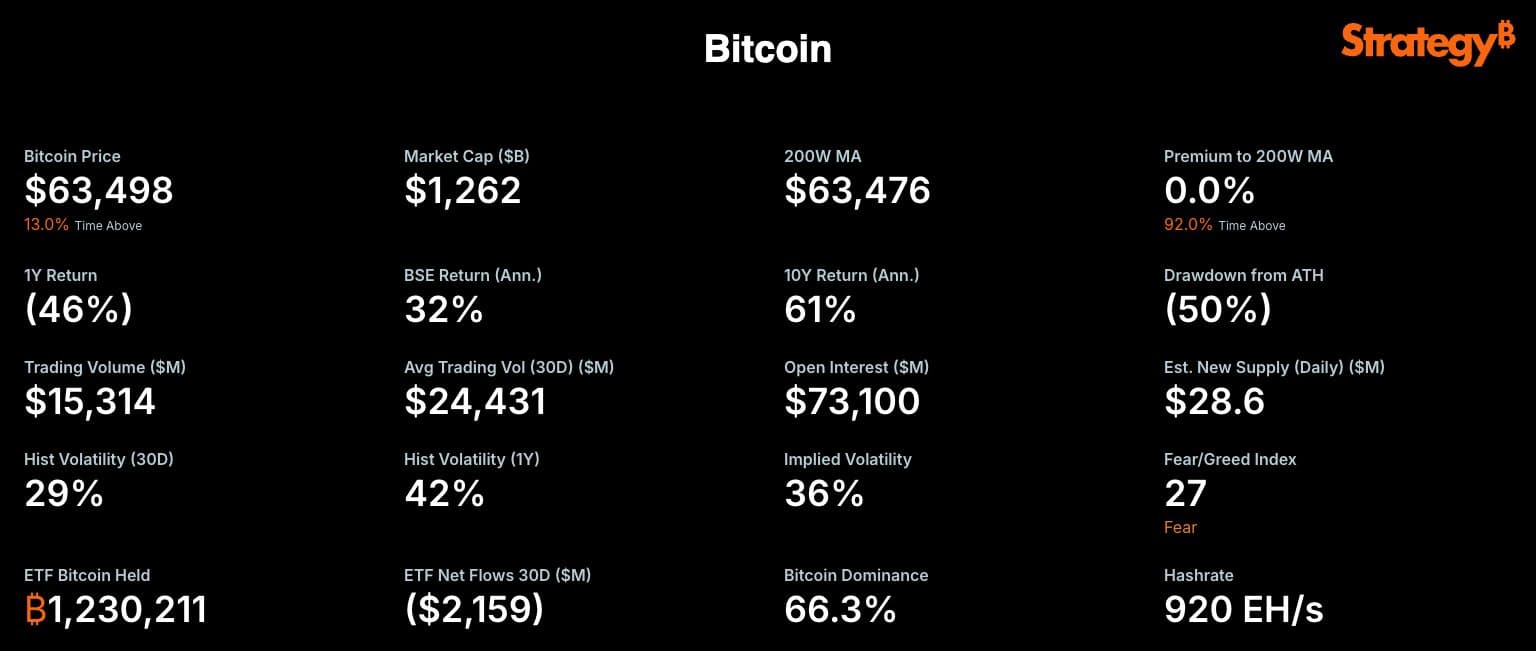
Recently, market analysts have observed a fascinating convergence. The valuation of large-scale Bitcoin holdings is currently tracking closely with the 200-week moving average. This specific technical indicator is widely regarded by traders as a vital benchmark for determining long-term trend direction and potential support levels in the cryptocurrency market.
Why the 200-Week Moving Average Matters
For long-term investors, the 200-week moving average acts as a ‘line in the sand.’ When the price of a major asset stays above this average, it is generally viewed as being in a macro bull market. Conversely, a breach below this level can signal a prolonged bearish period. The fact that large institutional positions are currently hovering around this threshold suggests a period of critical price discovery.
This alignment creates several implications for the broader market:
- Institutional Confidence: Large-scale purchases at these levels indicate a conviction that the long-term value proposition of Bitcoin remains intact despite volatility.
- Market Support: As prices approach these long-term averages, they often act as psychological and technical zones where buying pressure increases.
- Volatility Signaling: The proximity to such a significant moving average often precedes periods of increased market activity as traders decide on their long-term positions.
Looking Ahead: The Shift in Treasury Management
The shift from traditional cash reserves to digital asset exposure represents a fundamental change in how modern corporations view risk and inflation hedging. As more entities follow this blueprint, the correlation between corporate balance sheets and technical market cycles is likely to become even more pronounced. Investors should watch these technical milestones closely, as they often dictate the momentum for the next market cycle.